Plotting JWST images#
In this notebook, we will have a taste of the real data of James Webb Space Telescope. We take the images from the UNCOVER survey and plot them using python.
from matplotlib import rcParams, cycler
import matplotlib.pyplot as plt
import numpy as np
import os
import pickle
import astropy
Let’s download the images
Show code cell source
try:
    import google.colab
    IN_COLAB = True
except:
    IN_COLAB = False

if not IN_COLAB:
    if not os.path.exists("../_static/ObsAstroData/"):
        os.makedirs("../_static/ObsAstroData/")
    os.chdir('../_static/ObsAstroData/')

if os.path.isfile('cutoutRGB_NIRCAM.pkl'):
    print('Data is already there')
else:
    print('Download data')
    !wget https://github.com/AstroJacobLi/ObsAstGreene/raw/main/book/_static/ObsAstroData/cutoutRGB_NIRCAM.pkl
The data has been downloaded to ~/ObsAstroData/ folder if you are using your own computer. If you are using colab, the data is downloaded to the file folder.
Now we open the data using pickle and plot the images.
with open('./cutoutRGB_NIRCAM.pkl', 'rb') as f:
    data = pickle.load(f)
data.keys()
dict_keys(['rIMG', 'rWCS', 'rHDR', 'rfilt', 'gIMG', 'gWCS', 'gHDR', 'gfilt', 'bIMG', 'bWCS', 'bHDR', 'bfilt'])
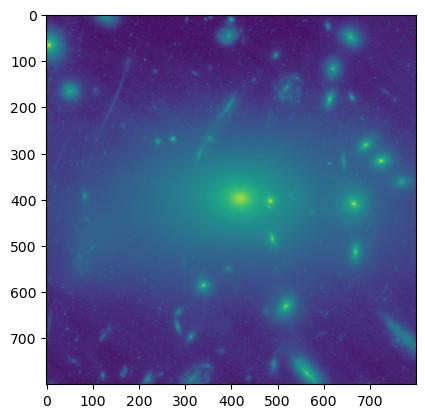
plt.imshow(np.arcsinh(data['bIMG']))
<matplotlib.image.AxesImage at 0x7fdd50c047c0>
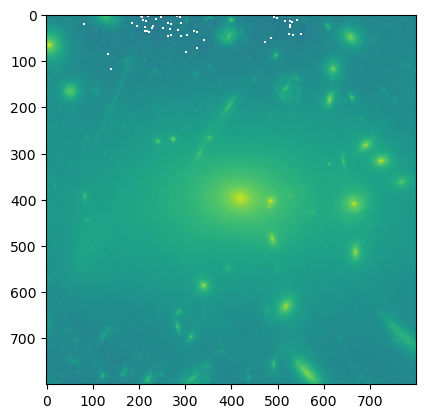
plt.imshow(np.log10(data['bIMG'] + 1))
/var/folders/l4/x41n5z4j4q9gypsb58tdh24c0000gn/T/ipykernel_51802/3008184174.py:1: RuntimeWarning: invalid value encountered in log10
  plt.imshow(np.log10(data['bIMG'] + 1))
<matplotlib.image.AxesImage at 0x7fdd720871f0>
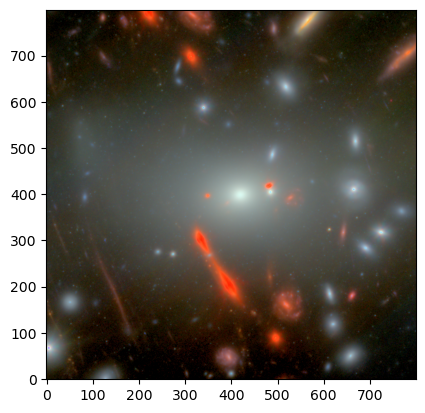
from astropy.visualization import make_lupton_rgb
img_rgb = make_lupton_rgb(data['rIMG'], 0.85 * data['gIMG'], 1.1 * data['bIMG'], Q=10, stretch=5)
plt.imshow(img_rgb, origin='lower')
<matplotlib.image.AxesImage at 0x7fdd00282a90>